24 July 2015

Headset Technical Specification comparison

I did a little technical comparison, based on online technical specifications, between the shown headsets. I found it interesting. Perhaps not surprising. On a qualitative level I note a 'very big' difference in sensitivity between the David Clarks and my Sennheisers. However I assume that I am driving them with an amplifier (a current audio  amplifier in my Elecraft K2 ham radio) and  may not necessarily be optimized for either.

I also do notice a difference in both low and high range frequencies between my Sennheiser and Earpods on listening tests. But still the Earpods are very very good and have to be some of the best value for money on the planet?

I would say that all 3 headphones would benefit from a Headphone Amplifier. 

Also note that the SPL measurement is made at one frequency only. Generally seems to be 1KHz. So the sensitivity may seriously degrade at the ends of the claimed bandwidth.

It is interesting to note the technical differences between the sets as optimized for different applications.

Given the complexity of comparing headphones due to many parameters way beyond this list I would think that the 'crowd sourcing' method of opinions may be the best way to make a determination as to which headset is best for you.

Headset technical comparison

18 July 2015

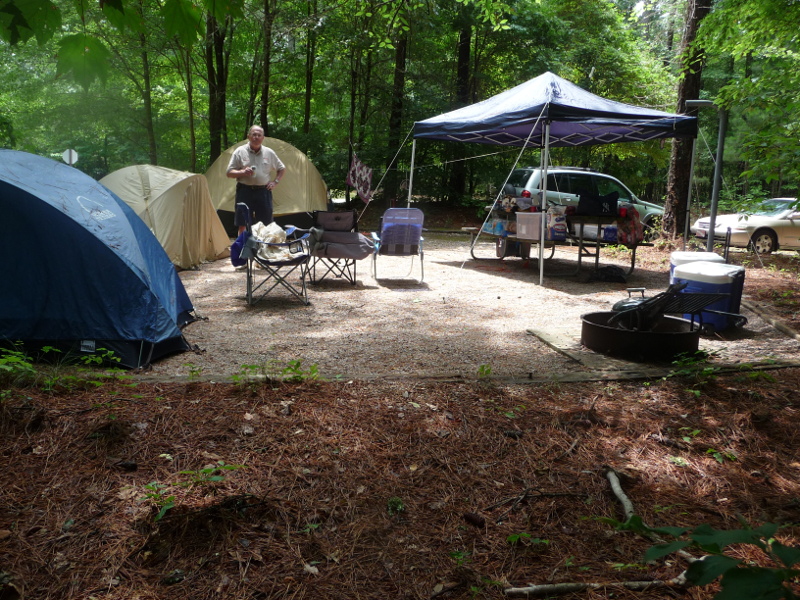
Field Day 2015. WQ4RP. The Knightlites

As in all previous years for me, Field Day 2015 with The Knightlites was a total pleasure! A great adventure and an opportunity to learn and appreciate the challenges presented from operating in the great outdoors in less than ideal circumstances. Certainly that was the case this year!

Four intrepid Knights Sirs Derek W4FI, Joe WA4GIR, JP AB4PP and Dick N4HAY operated Field Day as WQ4RP, Class 3A Battery, NC from the Holly Point State Park at Falls Lake North Carolina.


The Great Setup. Pics by Joe WA4GIR


Sir JP and Sir Derek before the action began. Pic by W4CHX Karl


Violent thunderstorms on Friday evening, and Saturday, destroyed a tent and relegated some of the Knights to sleeping in their cars. But the intrepid few remained at the Key...Sending and Receiving in spite of it all! Great adventure, camaraderie and plain good fun was had for sure.

MRE's issued by Sir JP just in case.  Pic by W4CHX Karl
A shelter destroyed by a violent thunderstorm. Pic by JP AB4PP
20m operating position.
20m operation position. Pic by Joe WA4GIR


Sir Derek WF4I pounding the key on 20m on Sunday morning


40M operating position. Pics Joe WA4GIR


Sir JP at the key. 80m, 15m, 10m operating position. Pic by Joe WA4GIR


Mason (or Consul) Jar LED lamp. A South African product
The Knight's Trebuchet built by Sir Gary N3GO.
This weapon gave us at least a 3dB advantage!
Some finer details of the event.

Background

Results

Operating Conditions

Lessons Learned

Inventory Checklist

DUP Sheet

Here find Band analytical information: 

10 meters

15 meters

20 meters

40 meters

80 meters

All Bands


WQ4RP The Knightlites. Field Day 2015 QTH.  Pic by W4CHX Karl


09 January 2015

Homebrew Attenuator Measurements contd

It was interesting to measure the insertion loss and maximum attenuator accuracy over a wider frequency range.

The BIG attenuator has a maximum attenuation of 68dB.
The Copper attenuator has a maximum attenuation of 71dB.


As for the previous measurements I used the HP 8657B as the 'standard' against which to compare.

I also used a 0dBm input level for the 71dB (copper attenuator) and 68dB (Big attenuator) measurements in order to move the measurements comfortably up from the lower end of the Power Meter measuring capability. The Power Meter in fact showed a consistent slope ranging from 20.5mV/dB for 1.6MHz to 19.69 mV/dB at 450 MHz. Quite cool for a homebrew power meter!

Reference the following links:

68dB slope calculation

Insertion Loss Measurements

Maximum Attenuation Measurements

In conclusion both attenuators show significant insertion loss and maximum attenuator errors for the 148MHz, 224MHz and 450MHz measurements.

'BIG' Attenuator

'Copper' Attenuator


Homebrew Attenuator Measurements contd/

Today I characterized another attenuator recently acquired and known as the 'BIG' attenuator on this blog. The performance of this attenuator over the HF frequency band is not as good as the 'copper' attenuator (results shown in the previous blog). The worst case measurement was on one of the 20dB pads at +1.06dB error. Although this unit is solidly constructed, I assume that the fact that it does not have shielded compartments between each attenuator must degrade performance over the frequency range. Perhaps also the switches used are not as good as slide switches for this application.

The shown measurements in fact are optimistic since they do not include insertion loss. I performed separate insertion loss measurements which are shown in the next blog.

As a part of these measurements I also characterized the slope of the Power Meter.

In conclusion, the attenuator certainly is useful for many functions at HF. Also the use of 1/4 Watt resistors will allow use in higher power applications.

The following links

Measured Attenuation

Pi network resistor values and calculations

Slope Calculations


07 January 2015

Homebrew Attenuator Measurements

I recently acquired a homebrew attenuator (called the copper attenuator in this blog). The construction is modeled in line with the QST article of September 1982 titled "A Step Attenuator You Can Build" by Bob Shriner WA0UZO and Paul Pagel N1FB although the named attenuator pad values were different.

On opening up the unit I was mystified by the values used for four of the PADS. The parallel and series values appeared to have been transposed in error. I reworked these values using standard nearest value resistors.

The switches are in excellent condition with no signs of wear. As can be seen from the linked spreadsheets below, I tested the attenuator over the HF frequency range only. A maximum of 0.1dB insertion loss was observed at 28MHz.

The worst case error observed was +0.4dB for the 16dB PAD.

With all PADS switched in to yield a maximum attenuation of 71dB the maximum error was 0.8dB at 10MHz.

Click on the link below for details of the measurements made. To return to this page please use the back button.
Attenuator Measurements

Click on the link below for details of the resistor Pi Network Values. To return to this page please use the back button.
Pi Network Resistor Values, dB(calculated), Return Loss (calculated)


28 December 2014

ears to our world, HumanaLIGHT and the Joule Thief

I was inspired by the recent excellent You Tube video made by W2AEW showing the HumanaLIGHT.

Reference: https://www.youtube.com/watch?v=qfgX93o8HzY

REF: W2AEW  You Tube #187. " A single cell LED light supporting EARS TO OUR WORLD"

Since the money for this kit goes to a noble cause, I decided to buy one. Check out www.etow.org for more information. In the process I also learnt something about the relaxation oscillator and the idea of the Joule Thief. A fascinating journey for me.

Since all is said on the video I thought I would simply record the results of my measurements here on the blog.

First I tried a dead battery that had a voltage of 0.47 volts open circuit. This did not light the LED.

Attaching a variable voltage power supply to the circuit I found that the LED just turns on at 0.8 volts and 'well on' at 1.02 volts.  Full on was measured as 1.74 volts.

Rail voltage was 1.3 VDC for the first three measurements below.

The circuit oscillates at 10kHz. Symmetrical wave form once fully on.

Here below are some views of the scope waveforms.

Output wave form to the LED. 3 volts p-p. Vcc was 1.3 v dc.
Base of final transistor that is connected to the LED. 


Capacitor feedback waveform 

Just turning on with a rail voltage of 0.79 volts


'Well on' rail voltage is 1.02 volts. 


01 November 2014

LTspice learning part 2

Following on from LTspice Learning part 1, I now proceeded to measure the behavior of the audio common emitter circuit. The objective being to compare the simple model, LTspice model and actual measurements.

I built a 1.59KHz phase shift oscillator based on EMRFD Figure 7.25. This was an interesting exercise and will form the topic of a separate writeup. This generator gave me a clean signal with less than 2mV of noise as seen on the scope.

For an amplifier signal output voltage of 1volt and assuming a voltage gain of 24 for the amplifier, I calculated that I needed about 70mV input to the amplifier. After measuring the open circuit voltage of the generator and the output resistance of the generator, and knowing the calculated input resistance of the amplifier, I calculated the need for a 2.82k voltage dropping resistor between the generator and the amplifier. I inserted a 2.7k resistor which gave me a measured amplifier input voltage of 63mV. This was in the ballpark.

I then measured the DC bias characteristics and the signal input and output voltages of the amplifier. I also tried to measure the signal voltage on the base of the 2N2222, however this signal was really too small to measure accurately on my scope.

Next I measured all the resistors in the circuit using a Keithley 179 DMM. These results were compared to the FLUKE 8024B results and seen to be within a few percent of each other. I also measured the transistor beta which varied between 160 and 175 depending on the DMM used. I carried out these measurements twice. Once on friday evening and again on this saturday morning. This morning the temperature was 47deg F in my attic where I was working. Certainly colder than last night although I did not measure the temperature then. All measurements were consistent except the beta measurement. I used a value of 168 for the calculations. I did not measure the ESR values of the capacitors however.

I then used these measured component values in the simple model calculations and the LTspice simulations. The results are summarized in the table directly below.

The results are extremely interesting and insightful to me. I found that adding an ESR (equivalent series resistance) of 2 ohms into the emitter 100uF bypass capacitor, I was able to obtain close correlation between the measured result and the LTspice simulation. Especially when comparing the signal load voltage results. The voltage gain measurements shown below have less credibility due to the difficulty in measuring the base input voltage (used to calculate the voltage gain). It is also interesting to compare the difference between the simulation with and without the 2 ohm resistor. There is a difference of 806mV-724mV = 82mV. Meaning a difference of 33mW power output.

The shown results for the simple model also include a 2 ohm regeneration resistor. Certainly this brought this result closer to the simulated and measured result but there is still a significant variance. Why?

Perhaps a useful conclusion from this exercise is that manual calculations are great to predict a ballpark result, however the LTspice IV simulator can get one much closer to the measured result. This conclusion cannot be validated, of course, without the ability to do many more precise measurements. Certainly beyond the scope of my simple 1970's era equipment workbench. Or is it?
 

Selected Parameters that serve to illustrate the differences in model results compared to the measured results

Bench test configuration


The LTspice generated schematic showing actual measured component values


A detailed spreadsheet showing all calculated and measured results


The phase shift test oscillator is powered by a 9V battery. Shown on the right and coupled to the audio amp on the left  with 1:1 test leads connected to the scope. No impact on the measurements, were seen from the test leads.

Scope display showing the amplifier input and output waveforms. The waves 'look' like 'clean' sinewaves.