I reworked the calibration procedures again for the 1N34A based power meter and the 1N4148 based power meters. The full calibration results are included on this Blog page.
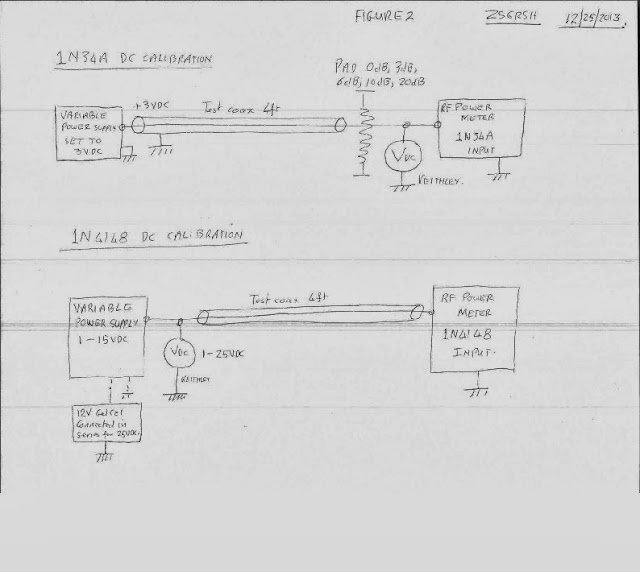
For the 1N34A I used a DC calibration procedure but this time I used my commercial attenuators to set the input DC Voltage levels. I then compared the measured voltages with the expected value. The correlation as can be seen from the table below is exactly the same. In other words the measured values = the expected values over the measurement range.
For the 1N34A meter I also injected RF power from my K2 rig into the RF power meter at FSD. I then inserted the attenuators using the same procedure as the DC readings. The Meter readings for the DC input and for the RF input at 7020KHz were exactly the same. This increases my level of confidence that the DC calibration method is valid, at least to within a single decimal place of a dBm measurement.
I also reworked the 1N4148 calibration. I reworked these due to the upgrade of the terminator to a newly built dummy load using 9X 2 Watt 470 Ohm resistors and 1X 1000 Ohm 2 Watt resistor (refer to the pics below). This allowed me to increase the calibration range up to 25 VDC. The voltage ranges used were set by varying the input DC Voltage from the variable voltage power supply unit.
Thus the RF Power measurement range now attainable from this power meter is summarized as follows:
1N34A
Vpk (V) 0.3 - 3
P (mW) 0.92 - 93
P (dBm) 0 - 19
1N4148
Vpk (V) 1.5 - 10
P (mW) 20 - 960
P (dBm) 13.5 - 29
Vpk (V) 1.8 - 15
P (mW) 30 - 2280
P (dBm) 15 - 33
Vpk (V) 2.91 - 25
P (mW) 80 - 6240
P (dBm) 19 - 38
Refer to the calibration curves below




|
1
|
Heading
|
1N34A RF
Power Meter Calibration
|
|
2
|
Label
|
RF Power
Meter Calibration
|
|
3
|
Date
|
12/23/2013.
|
|
4
|
Acknowledgements
|
1.
Author : ZS6RSH.
2.
Reference: EMRFD Section 7 paragraph 7.3.
|
|
5
|
Revision
|
Rev 2
|
|
6
|
Revision
History
|
This is a
repeat of the previous measurement but aimed at improved accuracy.
|
|
7
|
Scope
|
Calibrate the
1N34A RF Power meter using measured input DC voltages that are derived using
calibrated commercial attenuators.
|
|
8
|
History
|
Reference 6
above
|
|
9
|
Configuration
|
Refer
to Figure 2 below.
|
|
10
|
Test
equipment specifications
|
1.
Keithley model voltmeter.
2.
Homebrew variable voltage current limited, power supply 2VDC-15VDC.
3.
3dB, 6dB, 10dB, 20dB attenuators.
4.
Connection leads.
|
|
11
|
DUT
specifications
|
1. Homebrew RF
Power meter using a 1N34A diode.
|
|
12
|
Workbench
process
|
1.
Set the DC Voltage level and the variable pot to read 3VDC at FSD
2.
Insert the attenuators one at a time and record the DC input voltage
and the Meter Reading.
|
|
13
|
Expected
Results
|
1. The recorded input voltages should be
very close to the expected voltages when the attenuators are inserted.
|
|
14
|
Uncertainties
|
1. Keithly
meter inaccuracies. No difference to 2 decimal points is seen between the
Keithly and the Fluke voltmeters.
2. The RF
meter may respond differently to RF input as opposed to DC input. This
calibration method fundamentally
assumes that at least at 7MHz, that there is no measurable difference between
the DC and RF meter response. This was confirmed to 2 decimal places by
measuring the same meter readings for RF power input against the expected
attenuator values.
3. The
commercial attenuators are assumed to be accurate. The theoretical voltage
drops aligned with the measured voltage drops. Refer to the measurement
table.
4. The
termination load in the RF power meter is measured as 51.6 Ohms using the
Keithly Ohmmeter
|
|
15
|
Preparation
|
Start with the
DC voltage on the variable power supply set to minimum.
|
|
16
|
Perform
validation measurements
|
Both DC and
RF at 7020KHz were injected as separate measurements. Starting from a
baseline of approximately 3VDC FSD and 3VAC FSD the meter readings were
exactly the same between RF and DC for each inserted attenuator pad.
|
|
17
|
Perform the
full measurement plan
|
Carried out
as per 12 above down to approximately 0dBm
|
|
18
|
Observations
|
The results
were consistent with the expectation.
|
|
19
|
Change
Control
|
None
|
|
20
|
Computation
|
Calculate
the RF Power for each meter reading as P = Vdc^2/2R. (where R = 50 Ohms)
|
|
21
|
Analysis
|
The plotted
curve shows the transfer characteristic of the RF Power meter over the
measurement range.
|
|
22
|
Conclusions
|
Using the
calibration curve, the Power Meter will provide acceptable results. However
this should ideally be confirmed against a calibrated RF signal generator in
order to determine the accuracy with higher confidence. This procedure
fundamentally assumes that a valid result can be obtained by using DC Voltage
levels.
|
|
23
|
Documentation
|
Done as
shown on the Blog.
|
|
1
|
Heading
|
1N4148 RF
Power Meter Calibration
|
|
2
|
Label
|
RF Power
Meter Calibration
|
|
3
|
Date
|
12/23/2013.
|
|
4
|
Acknowledgements
|
1.
Author : ZS6RSH.
2.
Reference: EMRFD Section 7 paragraph 7.3.
|
|
5
|
Revision
|
Rev 2
|
|
6
|
Revision
History
|
This is a
repeat of the previous measurement but aimed at improved accuracy. The 50 Ohm
load termination was changed by using 2 Watt carbon resistors. This gives a
20 Watt power dissipation capability.
|
|
7
|
Scope
|
Calibrate the
1N4148 RF Power meter using measured input DC voltages. Calibrate the meter
using 2 FSD values of 25VDC, 15VDC, 10VDC
|
|
8
|
History
|
Reference 6
above
|
|
9
|
Configuration
|
Refer
to Figure 2 below.
|
|
10
|
Test
equipment specifications
|
1.
Keithley model voltmeter.
2.
Homebrew variable voltage current limited, power supply 2VDC-15VDC.
3.
Connection leads.
|
|
11
|
DUT
specifications
|
1. Homebrew
RF Power meter using a 1N4148 diode and a 20 Watt 50 Ohm Terminator.
|
|
12
|
Workbench
process
|
1.
Set the DC Voltage level and the variable pot to read 25VDC, 15VDC
& 10VDC at FSD (Full Scale Deflection)
2.
Reduce the input DC voltage and take an input voltage reading for
every 0.1 Ma meter reading as close as possible. Ie aim for 10 readings.
|
|
13
|
Expected
Results
|
1. The results should show a ‘fairly’ linear
transfer characteristic.
|
|
14
|
Uncertainties
|
1. Keithly
meter inaccuracies. No difference to 2 decimal points is seen between the
Keithly and the Fluke voltmeters.
2. The RF
meter may respond differently to RF input as opposed to DC input. This
calibration method fundamentally
assumes that at least at 7MHz, that there is no measurable difference between
the DC and RF meter response.
3. Parallax
error in reading the analog power meter
4. The
termination load in the RF power meter is measured as 51.6 Ohms using the
Keithly Ohmmeter
5.
Termination load (dummy load) heating resulting in resistance variances.
|
|
15
|
Preparation
|
Start with the
DC voltage on the variable power supply set to minimum.
|
|
16
|
Perform
validation measurements
|
At the FSD
levels the RF Power shown on the K2 Power Meter was the same as that derived
from the RF Power Meter.
|
|
17
|
Perform the
full measurement plan
|
Carried out
as per 12 above between the levels shown below.
|
|
18
|
Observations
|
The results
were consistent with the expectation.
|
|
19
|
Change
Control
|
The 10VDC FSD
was not possible to obtain with the variable pot and a 10K Ohm resistor in
series. A ‘FSD’ level as shown in the table was used instead.
|
|
20
|
Computation
|
Calculate
the RF Power for each meter reading as P = Vdc^2/2R. (where R = 50 Ohms)
|
|
21
|
Analysis
|
The plotted
curve shows the transfer characteristic of the RF Power meter over the
measurement range.
|
|
22
|
Conclusions
|
Using the
calibration curve, the Power Meter will provide acceptable results. However
this should ideally be confirmed against a calibrated RF signal generator in
order to determine the accuracy with higher confidence. This procedure
fundamentally assumes that a valid result can be obtained by using DC Voltage
levels.
|
|
23
|
Documentation
|
Done as
shown on the Blog.
|


