29 March 2014

Tuner & counterpoise efficiency tests using an RF Current sensor

The objective of these tests was to try to determine:

 1) The most efficient combination of tuner and counterpoise that will produce greatest RF current in a half wave, end-fed, field deployed, 40m, antenna. 
2) Determine the best combination based on received signal reports by ZS4SF based in Welkom. 
3) Determine the difference in signal strength between the best and worse case.

PROCEDURE: refer to the attached detailed schematic and pictures showing:
1) Test configuration.
2) Local conditions at the test site
3) Receiving station ZS4SF details
4) The 3 tuner details
5) The test results

GENERAL CONCLUSIONS
1) The combination of the 'Granadilla' tuner and 17ft counterpoise produced the best 'stable' result showing a marginal single S point improvement of 569 over the average signal reports of 559 using 2 Watts transmitter output.
2) The combination in 1) above also showed good consistent output on the RF current meter although the combination of the Granadilla tuner and 8.5Ft counterpoise showed a higher RF current, however the setup was unstable and variable.
3) The Z Match showed the worst performance of the 3 tuners with all 3 counterpoises. The DC meter sensitivity control had to be increased in order to obtain an RF current report. However 559 and 549 signal reports were still received.
  
KEY CONCLUSION
1) Based on the signal reports from ZS4SF there was a marginal difference of  less than 1 'S' point (estimate 4dB) between the best and average cases. Indicating that all combinations are acceptable for real field deployments.

OBSERVATIONS
1) It was difficult in a real field deployment to get a consistent RF current measurement with the output varying depending on proximity effects. 
2) None of the combinations were completely stable indicating that tweeking is required to reduce the ground currents and to obtain a resonant antenna with minimum reactance present. (difficult to achieve in the field).

PROXIMITY AFFECTS
1) Upon terminating the Granadilla tuner on the bench with a 4.7K resistor after the field tests, it was determined that the resonant frequency was at 7.487MHz. This is 7.487 - 7.020 =  467KHz difference. Assuming the tank circuit inductor is fixed at 4uH, this reveals a capacitive contribution of 16pF from the antenna/counterpoise system contribution. If this contribution came entirely from the antenna wire then the effective antenna length can be calculated as 71.4ft (as opposed to 66.66ft actual length).  This seems to be a big difference in length and may explain why the system was unstable during the tests.

GRANADILLA TUNER ADVANTAGE
The Granadilla tuner has two key differences when compared to the Altoids tuner. It uses an Air variable panel mounted, screw driver adjustable, 30pF capacitor, in parallel with a 10pF silver mica capacitor with a 500V rating. The Altoids tuner uses a 150pF polyvaricon capacitor. Both tuners use the same T-50-2 inductor. The Z Match utilizes two polyvaricon capacitors. Could it be the polyvaricon capacitors that exhibit losses in this environment. 

Assuming a radiation resistance of 3000Ohms and 2 watts, the peak-to-peak voltage across the tank circuit = SQUAREROOT( 8 X P X R)  = SQUAREROOT(8X2X3000) = 219Volts. Does this voltage stress the polyvaricon capacitors?

This was a fun project and very instructive! My thanks to my friend OM Monk in Welkom ZS4SF for hanging in there and providing 12 signal reports. Thanks Monk! 73.


Z Match, Granadilla Tuner, Altoids Tuner

View of the RF current sensor connected to a sensitive DC analog meter (0-1mA)


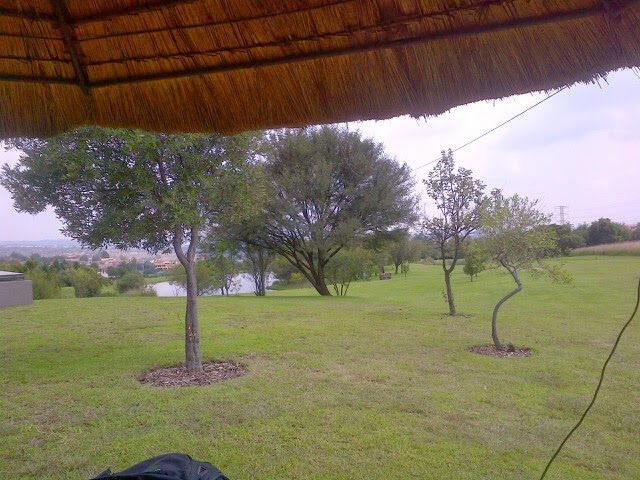
View of Antenna, Cedar Lakes upper picnic table, Fourways, Gauteng, South Africa 


Granadilla in South Africa is known as passion fruit in the USA. Yummy!

The 7020Khz capacitor pure resistive position terminated in a 4.7K resistor. Antenna reaction is tuned out in the field.


27 March 2014

Understanding the RF Current sensor (2)

Following from tests conducted and recorded in the previous blog I had to now compare the Z Match output with my Tank Circuit coupler that I have used for many years to feed a 40m end-fed. This was done using additional bench tests in the same manner as before.

I could not match the 3000 Ohms to the tank coupler with 1:1 SWR. The best obtained was a 1.7:1 match. I then substituted the tank coupler with the Z Match. I was able to tweek this to an SWR of 1:1.

Results:   Tank Coupler   DVM reading = 315mV  SWR 1.7:1
               Z Match          DVM reading = 340mV   SWR 1.1:1
               Z Match          DVM readings = 277mV, 331mV, 330mV, 277mV various settings SWR 1.7:1

Some interesting observations.  At the 1:1 SWR on the Z Match the greatest output was obtained. However if the input power is adjusted for SWR 1.7:1 = 93.3% efficiency, thus input power = 1.2*0.933 = 1.11Watts.  If I reduce the power input to the Z Match by 6.7% I derive a DVM = 315mV. This being the same as the Tank Coupler. Looking at the Z Match DVM, SWR 1.7:1  readings they are highly dependant on the settings of the capacitors. However they are all in a similar 'ball park'.

Thus I conclude that the couplers have a similar efficiency at least at 7020KHz.

When comparing to the theory. The DVM readings are significantly lower that the calculated value of 463mV (see previous blog). Is this an indication that the loss is attributed to the RF current transducer?

Understanding the RF Current sensor

I thought it might be instructive to set up a bench experiment to try to understand the performance of the RF Current sensor. To keep it simple I measured the sampled RF current at just 1 frequency 3579KHz.

In order to simulate an end-fed halfwave input impedance, I terminated my Z Match in a 3000 Ohm resistor. I then linked the termination through the RF current sensor. After measuring the K2 output at 1.2 Watts I then connected the K2 to the Z match and tuned the Z match for a 1:1 SWR. Best I could get was in fact a 1.1:1 SWR. I measured the RF current sensor output at the RF point across the 270 Ohm resistor using my scope with a 10X probe. I measured the DC output using the Keithley DC DVM.

I then compared the results with some theoretical calcs which assumed that the system was 100% efficient. ie all power from the K2 is transferred to the 3K load AND all power from the current sensor is transferred to the DVM and Scope readings. Here is a summary of the results obtained.

DC voltage output (calculated) from the sensor = 463mV. Measured DVM DC voltage = 255mV
Voltage output (calculated) across 270 Ohm resistor = 763mV peak. Vpeak measured = 490mV.

In the end the only observation would be that the measurements were 'in the ballpark' of the expected results.

There could be many reasons why the discrepency. Listed as follows.

1) K2 Power output measurement error on the Power Meter
2) 1.1:1 SWR is not a perfect match.
3) Losses in the Z Match.
4) Load not exactly 3000 Ohms at 3579 KHz (did not measure the actual resistor values)
5) Core losses in the current transformer
6) Incorrect theoretical calculations
7) DVM and Scope measurement errors
8) Loading effect on the circuit from the DVM/Scope
9) Assumed forward voltage drop of 300mV across diode is incorrect

Looking at item 6 it is not clear how accurate the assumption is on current transformer core action. In practice this could be widely different to the theoretical 10:1 turns ratio. I assumed that all available current would be extracted across the resistor? This is probably not correct. I don't know how to calculate this value. More education required on transformers. Without knowing what the actual efficiency is of the Z Match it is not possible to narrow down the discrepancy.

The most practical next step would be to perform the test with another 2 transmatches. This way it would be possible to get some idea of the difference in efficiency of the transmatch section of the test.


Test Setup showing the Z Match terminated in 3000 Ohms and with the RF Current sensor inline. 


DVM = 248mV and Scope showing peak to peak RF across the 270 Ohm resistor of 980mV

RF Current sensor with scope probe in place


25 March 2014

RF Current measurements on a Long Wire W3EDP antenna

Having seen that it is difficult to obtain accurate RF radiation measurements using a field strength meter, I next resolved to measure the RF current on the 84ft inverted L W3EDP antenna deployed in my garden.

I built an RF Current measurement transducer according to the schematic developed by Dave ZS6AZP. I built this transducer in an evening into an altoids tin. The build came together very easily.

Having previously built a DC analog meter for my Field Strength meter I simply connected that meter to the RF current transducer. This scheme worked very well.

I found it much easier to obtain consistent readings using the RF Current sensor as opposed to the Field Strength meter.

Terminating the Current meter in a 51 Ohm load and driving the system with my K2 TRX, I established that the minimum power detectable with this meter into a 50 Ohm load is approximately 100mW across the HF band. No doubt by using a germanium diode lower currents could be detected.

The results were revealing to me. On both 80m and 40m the peak RF current was definitely not at the 1:1 SWR load point. Refer to attached for more information of the test. Why is this?

I also noted that at the test power level of 300mW that the output RF current dropped (amount not quantified) as the test proceeded. Was this the effect of heating in the Z Match?

By maintaining the same output power from the K2 TRX and keeping the DC Meter sensitivity the same I was able to compare the RF Current on 80m and 40m when connecting the system to a 17ft and 33ft counterpoise respectivily. I then loaded the system against the two different counterpoises by adjusting the Z Match. I noted that the 17ft counterpoise in both cases, resulted in more RF current than the 33ft counterpoise. In fact the meter did not even deflect with the 33ft wire attached. The 17ft counterpoise is over the grass lawn whereas the 33 ft counterpoise lies along the concrete path. More experiments with counterpoises warranted. Noted that the W3EDP design in fact calls for a 17ft counterpoise. Perhaps W3EDP knew what he was doing :).

In my morning sked at 6:30 am on 3579KHz with OM Barrie ZS6AJY, Barrie reported that I was a 579 but that my signal was 'the strongest he had heard'. hi. I was using the 17ft counterpoise.

NOTES: The shunt resistor across the inductor = 270 Ohms.
               The inductor is a FT50-43 with 10 Turns on the secondary and 1 turn on the primary (pass the                       antenna wire through the toroid).
               Calculated inductance = 44uH, Measured inductance = 45.8uH


RF Current sensor inline with an inverted L 84ft W3EDP antenna with 17ft counterpoise and Z Match tuner.


24 March 2014

A sensitive Field Strength Meter

This weekend I had an interesting time experimenting with Field Strength Meters (FSM). I am interested in deploying a FSM in my garden in order to see if it will provide me a relative indication of the efficiency performance of different couplers for my end fed antennas.

I started out by measuring a range of different germanium diodes by simply measuring the forward resistance of the diodes using my Fluke 8024B multimeter set on the 2K Ohm scale. I am not sure how valid this is but I have read that it is used as a means to obtain a matched pair in the reference documents. I selected a 1N270 diode with the lowest resistance to use as a detector (ref notes below). I noted a significant difference in forward resistance between the 1N60P, 1N34A and 1N270 germanium diodes. Further experimentation needed. Presumably the lower the forward resistance is the lower the threshold voltage will be?

Based on a discussion with ZS6AJY who uses a FSM on a regular basis at his station, I started out by experimenting with a simple diode/capacitor circuit which would detect and rectify RF. I found that this was not sensitive enough. My aim being to use for low power (ideally +6dBm which is the power output of my MFJ259B antenna analyzer) for my antenna system measurements. I could get a meter indication at 5 watts when using a 500uA FSD ammeter. SInce I have a nice big 1mA FSD meter I looked for an amplifying circuit.

I then built a meter based on W1FB's circuit found on pg 147-148 of the W1FB QRP Notebook. This is an interesting circuit that uses 2 diodes as a voltage doubler. It also utilizes a tuned tank circuit to aid in improved peak performance. When I connected my 500uA FSD ammeter to the rectified output I was able to get a half meter scale deflection on the workbench with the MFJ nearby. The MFJ had a piece of wire about 5 feet long connecetd to its output while the FSM had a 3 ft antenna wire. Significant improvement in sensitivity was found by connecting a ground wire between the FSM and the MFJ generator. The circuit has a high Q and is very touchy as a result. This is not surprising since the tank circuit is lightly coupled to the detector using only a 10pF capacitor. I was unable to obtain a reading if the tank circuit was off resonance. I tried a number of frequencies from 2MHz - 20MHz and all were able to deflect the meter to FSD with the sensitivity control increased. The cut-over point between the 'HI' and 'LO' setting is somewhere in the 7MHz range. When the HI position is switched in the smaller inductor is switched in circuit parallel to the larger inductor, resulting in an inductance of 1.4uH. For the low range the ferrite core inductor provides an inductance of 22uH.

I built the DC meter with a 2N3904 transistor amplifier and with no emitter regeneration.  The original design uses a 1.5V battery supply. Since I only had a 3V battery holder on hand, I inserted a 1.5K Ohm resistor in parallel with the 1mA FSD meter. This is an old antique Weston meter that I obtained from ZS6AJY. It is nice to see it working again!

I installed the meter in the garden about 4 feet from the base of the end fed antenna. On 80m I was able to get a FSD easily with 1 Watt output. The meter is extremely sensitive and selective. The tank circuit has to be resonating on frequency in order to obtain a meter deflection. Once that 'sweet spot' is obtained then the meter is extremely sensitive. As I moved around the base of the antenna the meter clearly showed coupling going on between the wire and my body. I found I had to lie on the grass to minimize the effect. I also found that the FSM showed maximum deflection at a point where the SWR was in fact closer to 2:1. Was this due to the FSM picking up RF now being radiated by the coupler or was this in fact the point of maximum radiation from the wire? More experiments needed. On 7020MHz I found the environment even more sensitive and difficult to work in. One thing is for certain. This meter is extremely sensitive. More experimentation needed.

For me the FSM is a great learning tool. It gives one a 'feel' for RF and a visual indication of what is occurring at the base of an end-fed wire.


1-30MHz Field Strength Meter. LO~1-7MHz, HI~7-30MHz.


Sardine tin used for the FSM case.

Diode Measurements

Basic Meter tests lacked sensitivity. W1FB design with a tank circuit and voltage doubler/recitifier.

DC amp circuit design

Collector resistor design for a Vcc = 3V. 


19 March 2014

Making PC boards the size you need

My shack here in South Africa is equipped only with hand tools and a power drill. Since I have a lot of PC board on hand it makes sense for me to fashion my enclosures from PC board. To make the pieces fit neatly together, I have spent large amounts of time filing the boards into shape. I find that the aviation 'tin snips' I use to cut the PC board work well, but it is very difficult to cut an accurate and straight edge.

Here is a method that works for me. I use a jig consisting of a trimmed piece of particle board about 1ft X 8 inches in size and about 3/4th inch thick. Along the straight edge I secured a piece of aluminum strip flush with the particle board top surface. This strip is screwed on with countersunk screws. At right angles to the straight edge and at one end of the board I have drawn a straight line to act as a guide to ensure the pieces are shaped with the edges parallel and at right angles to each other.

Procedure

  1. Mark out the PC board and cut it closely to shape using the tin snips. 
  2. Select one of the edges as a straight/master edge upon which all measurements and right angles shall be based. 
  3. Line this edge up with the aluminum strip edge, ensuring that minimum wastage occurs but at the same time leave a small amount protruding to allow a good trim.
  4. Press down firmly on the PC board with one hand to ensure that it does not move during sanding.
  5. Sand off the excess using the circular sanding tool fixed in the drill chuck, operating at high speed. (see pictures below). Don't over do it otherwise the aluminum strip will be sanded also. Keep the drill vertical to the jig.
  6. Smooth the edge further using a file and then fine sandpaper.
  7. Perform the same procedure on all edges ensuring the piece is exactly the dimensions required.
  8. Now use this piece as a template for the remaining boards. The other boards will be marked slightly larger due to the marker thickness. This is all good since they can be trimmed to the required dimensions using the jig as described.
This procedure takes much of the pain and time out of filing. Arguably, making the enclosures turns out to be a bigger and tougher job than putting the electronics together hi!

Jig with aluminum edge, straight-edge, tin snips, markers, sanding tool, finishing file

Hold the board firm and do the sanding outside. PC board dust is no fun!


18 March 2014

Matching efficiency tests for a W3EDP antenna

Today I conducted some interesting experiments on my 84 ft end fed antenna. Also known as a W3EDP antenna. Based on recent signal reports I have felt that this antenna does not perform as well as an end fed halfwave on 40m.

I replaced the homebrew coupler (see schematic below) with my Emtech Z Match. I was able to easily load the antenna against a 17ft or a 33ft counterpoise respectively, laid out on the lawn. These are insulated wires.

I received good reports from ZS4SF in Welkom on several tests throughout the day. All 599+ reports.
On swapping between the two tuners I consistently received better reports on the Z match with marginally better reports using the 17ft counterpoise.

I then set up my power meter at a distance of about 6 ft from the antenna. I inserted a 3ft piece of wire into the RF socket of the Power Meter to act as an antenna. In effect this is a very sensitive field strength meter. The meter certainly registered 'background' RF that was approximately -60dBm. A preselector tuned to 7020KHz would be an interesting experiment.

I then connected the MFJ259B to each coupler in turn and switching between the two different counterpoises.  The MFJ generates a signal at 7020KHz of +6dBm. This registered above the noise on the Power meter by a good margin (not measured) and enough to conduct the planned tests. By adjusting the tuner, I was clearly able to see the power meter detect increased  power as the tuners were matched and the SWR was 1:1. It is quite interesting to see how the radiated power drops off significantly as the SWR exceeds 3:1. Thus I was able to peak the radiated power in line with a 1:1 SWR on the Power (Field Strength) meter.

I determined that the Z Match with the 17ft counterpoise was in fact generating a measured 7 dB greater power into the antenna when compared to the home brew coupler connected to the same counterpoise.

I then spent time adjusting the turns on the home brew coupler coil. It appeared that more efficiency could be obtained by increasing the number of turns on the coil from 7Turns to 13Turns. Resonance was then obtained with the capacitor at almost it's minimum setting. Link turns were adjusted to achieve a 1:1 SWR. However I was unable to achieve the radiated power output level seen when the Z Match was used..

Further experimentation needed.


17 March 2014

Manyane camp at Pilanesberg National Park March 2014

Dung Beetle hard at work!
We had a wonderful weekend at Manyane camp/Pilanesberg national park, as usual. Given the unbelievable rains this past two weeks we were not sure what we would find there.

In the park we were only allowed to drive on the tar roads and one dirt road. We were amazed at the road destruction caused by the rains. There was water flowing everywhere with water flowing in over abundance out of the sodden ground.

From a radio perspective I deployed my usual end-fed half wave up into a tree at about 30ft height. This was a very easy deployment with the launch going smoothly and with only one try. This trip I used my field coupler which is a parallel circuit consisting of 30T on a T50-2 and a poly varicap installed in a altoids tin. I am amazed how well this coupler works. I also took along my ZM2 Z match tuner. In comparative tests with om Monk ZS4SF in Welkom he could not tell the diffference between the couplers. I received excellent reports all weekend for my 5Watt QRP signal with Monk saying that my signal was better by at least 2 s points over my home system which is an 84ft end fed wire. I always receive good signal reports on my EFHW and have full confidence in it.

Using the ZM2 I also tuned up on 20m and 15m. The bands were alive and DX condx were obviously good. The highlight of the weekend was a 5Watt QRP contact with PY2GQT on 40m just at sunrise 04:15UTC on Saturday morning. He gave me a 439 signal report hi.


We saw at least 9 Rhino this trip

Our favorite waterhole Ratlhogo was full to the brim with not an animal in sight

Operating in luxury


14 March 2014

Air Variable Capacitor brackets

As a part of my RF source generator project I need 2 ganged Air Variables. In my junk box I have a number of high quality air variables from a Company called Kopt. A search on the internet turned up a number of capacitors from this company. However I could not find which country of origin they come from.

Here are the capacitor details:

MANUFACTURER: Kopt
PHYSICAL SIZE: 1.25 inches wide X 1.75inches high X 2.25inches deep
REDUCTION GEARING:  2.75 turns
ENCODING SHAFT: Not geared. Protruding from the rear.
BODY: Cast aluminum
BALL BEARINGS: On one end
PLATES: Aluminum and very closely spaced.

Each unit contains 4 ganged capacitors as follows:

Front   C1  20pf - 400pf
Front   C2  10pf - 25pf
Rear    C3   10pf - 300pf
Rear    C4   10pf - 25pf

The issue with these capacitors is that they are not easy to mount having unusual hole locations. Not having a shop full of tools my challenge was to fashion brackets that I could make with hand tools only and which would be sturdy enough to ensure full stability of the capacitors. ie they should not vibrate when the chassis is touched.

So far I have made the brackets (see pics below) from thin galvanized iron which I obtained from an air conditioning duct cover at the local hardware store for R30. This was already in the shape of an angle piece which meant that I did not have to try to make an angle piece myself.

I first made a trace of the hole locations using a paper template. I transferred the hole locations onto the iron plate and then cut the pieces using a pair of aviation tin snips. I then drilled and filed the holes. I first made 2 master templates which were then used to mark out the rest of the brackets. While I was doing the job I went ahead and made brackets for 6 of these capacitors.

Since I did not have any bolts that were the right thread I had to 'self tap' the holes using some american standard 6-32 bolts in stock. Luckily these fitted well and the soft cast aluminum was easy to tap.

The local 4mm bolts are slightly too big for these holes. They would need to be bored out with a number drill and then self tapped. Assuming the 4mm bolts are made of hard enough steel to cut the aluminum.

Next I cut the bolts to a length where they did not protrude into the capacitor moving mechanism. This I did with a hacksaw and a pair of vise grips and a file. After tweeking the holes a bit with a small round file I bolted the brackets to the capacitors. I then soldered a cross piece in under the bracket to improve the stability. As can be seen in the pics below, the brackets are quite high. This is necessary to allow room for a large knob to be easily turned.

I then bolted the capacitors to a piece of PC board which will serve as the floor for my RF generator. To improve stability further I screwed the PC board onto a solid piece of very flat particle board.

It will be interesting to see how stable this arrangement will be in practice.


Brackets made of air conditioning duct cover that already has the angle piece. Cut with tin snips.
Underside showing a cross bracket soldered in place to improve rigidity
Ball bearings at one end of the shaft. Also includes a 2.75 turn gear and an encoding shaft out the rear
Capacitors mounted on a piece of PC board, mounted to a piece of particle board to improve rigidity. RF signal generator. project.


10 March 2014

Characterization of a 14.5MHz low pass filter

 I built a Chebyshev n=5 filter and then tried to characterize it. Since I am using an 11MHz sine wave generator for calibration I started out with the aim of realizing a 13.2MHz filter. Refer to EMRFD Chapter 3 for filter design. Since I didn't have any 330pf caps on hand I ended up with a 14.5MHz (peak cutoff) filter using 300pF capacitors.

I was unable to detect the ripple in the filter. Instead it showed a flat response until about 9MHz with an insertion loss and ripple that I could not measure with my power meter.

The following results were obtained.

RL = 22dB
-3dB cutoff point = 15.61MHz
-5dB Passband = 16.4MHz.


09 March 2014

JFET biasing experiments

Today I continued with the biasing experiments. I redid the tests for Sample 1 and MPF102 and the results were the same as previous measurements.

I then ran the same tests on Sample 2 MPF102 and Sample 3 J310

The results are shown below for sample 2 and 3.

Using the FET equation to try to achieve a curve fit I estimate the Vp and Idss values as follows:

Vdd = 10.18V

SAMPLE        Vp        Idss
1 MPF102      -2.27      9mA
2 MPF102      -3.6        9.7mA
3 J310             -2.98     33.8mA

For the J310 the specification states that Idss can fall between 12mA and 30mA. Clearly this sample is at the upper end.

According to this analysis sample 1 would have the lowest power output and the J310 the highest. Next step will be to build a Hartley oscillator and measure the power outputs.

JFET test fixture

Sample 2 MPF102
Sample 2 MPF102
Sample 3 J310
Sample 3 J310